These are the words that show up in your TrainingPeaks comments, your race plan and my posts. Each one gets a short definition here and a link to the post that goes deeper. I’ll keep adding to it as the research I read each week earns a place.
Jump to: TSS · CTL · ATL · TSB · FTP · NP · IF · CSS · Zone 2 · Lactate threshold · VO2max · Decoupling · Durability · Heat acclimation · Brick · Efficiency · Decoupling and durability in real files
TSS (training stress score)
TSS puts one number on how much a session cost you. An hour at your threshold is 100 TSS.
It scales with the square of intensity, so a hard hour piles up load much faster than an easy one. Swim TSS reads high for most people, because pausing your watch at the wall makes the pace look faster than it was. I correct it for my athletes.
More on how TSS can mislead you: training more and getting slower.
CTL (chronic training load)
CTL is your fitness line in TrainingPeaks: a rolling average of your daily TSS over about the last 42 days.
It’s a good gauge of you against yourself, and a poor one of you against anyone else. TSS depends on your own threshold settings, so 2 athletes with the same CTL can be in very different shape.
I watch the ramp more than the level. On a load week, 3 to 5 CTL points is the safe ramp.
More: training more and getting slower.
ATL (acute training load)
ATL is your fatigue line: the same rolling average as CTL, but over about 7 days.
So it jumps after a big weekend and drops within days of an easy week. On its own it tells you how much you’ve done lately. It’s most useful next to CTL, which is the next entry.
More: training more and getting slower.
TSB (training stress balance)
TSB is your form score: fitness minus fatigue, CTL minus ATL. Negative means you’re carrying fatigue, which is normal in a build. Positive means you’re fresh.
For Ironman race morning I want TSB somewhere between +5 and +20. In a build, below about -25 tells me we’ve dug too deep. And coming back from a short illness, a high TSB is headroom to use.
More on reading it before a race: training more and getting slower.
FTP (functional threshold power)
FTP is roughly the best power you could hold for an hour. My test is a 20-minute all-out ride after a warm-up and a 5-minute hard effort, and FTP is 95% of that 20-minute average.
I use it to set your zones and track a build. A fresh number says little about what you’ll hold at hour 4, so for long races I lean on durability. I test about 3 times a year at most.
More: durability in endurance sports.
NP (normalised power)
Normalised power is a weighted average that leans on the hard bits of a ride. On a surgy group ride your NP comes out well above your average power, because the surges cost you more than the average shows.
It’s why a long ride’s NP can sit close to your FTP without meaning your FTP is wrong. On long-course race day I use NP as the ceiling: if it’s over target at halfway, back off.
More: how to pace a 70.3 bike.
IF (intensity factor)
IF is your normalised power as a fraction of your FTP. An IF of 1.00 is an all-out hour; an easy endurance ride sits well under 0.75.
It’s the cleanest way to say how hard a race bike leg was, and it feeds TSS. Double the IF for the same hour and you get 4 times the TSS.
More, with 3 real race files: how to pace a 70.3 bike.
CSS (critical swim speed)
CSS is your threshold pace in the pool, worked out from a 400m and a 200m time trial. It does the same job for swimming that FTP does on the bike.
My training plans use a 400/200 CSS test in week 1 to set your swim paces. With my 1-on-1 athletes I mostly write swims by effort and rest instead.
CSS gets more precise than most swimmers can control. If yours is 1:33 per 100m, the sets end up at CSS +6 or CSS -3 seconds. Most people swim in 5-second blocks, so that’s how I write the sets.
More: training plans.
Zone 2
Zone 2 is the easy aerobic effort that builds your engine. You can talk in full sentences, it feels like 3 or 4 out of 10, and on the bike it’s about 56 to 75% of FTP.
Most of your week lives here, and the hard sessions are the smaller slice that fits around it. It’s easy to drift into zone 3 and call it zone 2, so I check the heart rate and the decoupling.
More: zone 2 training, the complete guide.
Lactate threshold
Your lactate threshold is the effort where lactate starts to build faster than you can clear it. On the bike it sits around your FTP, and threshold sessions live at about 91 to 105% of it.
I want about 30 to 60 minutes a week at or near threshold in most phases. Your threshold moves when your ceiling (VO2max) goes up or when going fast gets cheaper, which is why strength and economy work matter as much as the threshold sessions. And eat normally the day before a threshold test, because a low-carb day can drag the result down.
More on using it to set zones: zone 2 training, the complete guide.
VO2max
VO2max is the most oxygen your body can use, flat out. Think of it as the ceiling on your engine.
It fades faster than threshold if you leave it alone, so I put a VO2 session in about every 7 to 10 days, even in base. Something like 4 x 4 minutes or 30/30s, aiming for 12 to 15 minutes of real time near the top. If only one hard session fits in a busy week, that’s usually the one I keep.
More on the ceiling versus how long you can hold it: durability in endurance sports.
Decoupling
Decoupling compares the first half of an effort with the second. If your heart rate climbs while your power or pace holds still, that’s positive decoupling, and it tells you the effort is getting more expensive.
Read it over the work only. A whole file with the warm-up and stops in it can show 15% and mean nothing. The 5% rule is for long steady aerobic rides and runs, so don’t quote it on a threshold rep.
On reps, compare yourself with yourself at the same watts. You can see both in real files below.
More: durability in endurance sports.
Durability
Durability is fatigue resistance: how little your power, pace or efficiency drops as a long day goes on. For Ironman and 70.3 it’s the quality I care about most.
I test it inside one long ride. Two matched blocks at Ironman power, the first about an hour in and the second around hour 4, then compare what each one cost you. If the second one faded, I ask what you ate and drank before I call it fitness.
More: durability in endurance sports.
Heat acclimation
Heat acclimation is training your body to cope with a hot race: more plasma volume, earlier sweating and a lower heart rate at the same effort. It comes on fast, inside about 5 to 7 days.
About 8 to 10 sessions of 60 to 90 minutes, mostly easy, gets most of the benefit. Expect roughly 3% in a hot race. It fades about 2 weeks after your last session, so keep it close to race day and never stack it on a heavy training week.
More, for Kona: heat training for Kona.
Brick
A brick is a run straight off the bike. Most of mine are 15 to 20 minutes of easy running to get your legs used to the change.
In the build, some bricks carry race intent, like running the back half at race effort. It’s the cheapest race-specific session in the week, and I count the run as run load.
More: IRONMAN New Zealand on 10 hours a week.
Efficiency (EF): how I watch you get fitter
Efficiency is how much you get out for each heartbeat. On the bike it’s watts per beat, which TrainingPeaks calls efficiency factor (EF). On the run I count heartbeats per km, and in the pool I track pace and strokes per length.
It’s the number I watch most between tests. You test your FTP 3 times a year at most, but efficiency shows up in every easy session you do.
Every night I pull your raw files and look only at the steady parts. I drop the first 10 minutes and keep stretches of 20 minutes or more inside your easy band: 60 to 78% of FTP on the bike, your easy heart rate zone on the run, with the pace adjusted for hills. The charts below are 3 of my athletes, with no names and no dates.
Bike: more watts for fewer beats
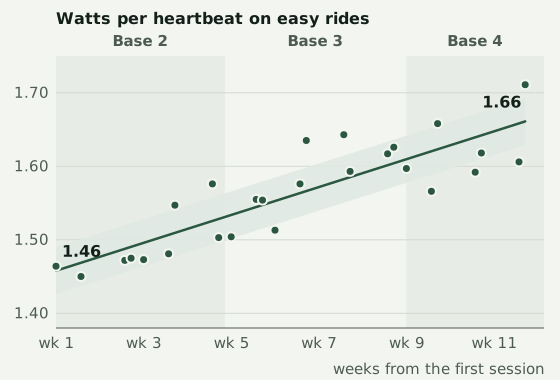
26 easy rides across 3 base blocks. In the first block they averaged 179W at 120 bpm.
By the third it was 187W at 115 bpm. The trend line went from 1.46 to 1.66 watts per beat, up 14%.
The shaded band is the normal ride-to-ride wobble, about 2% for this athlete. One good ride inside the band means nothing. A line that climbs well clear of it does.
The same long ride, 7 weeks apart
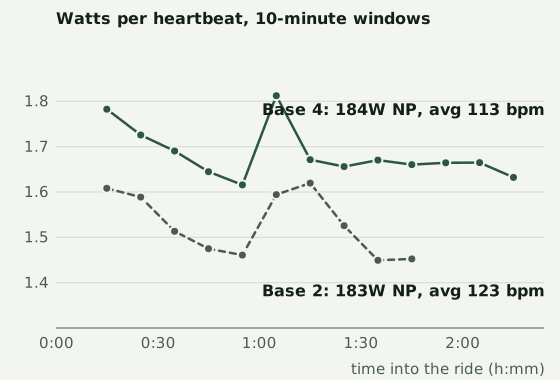
Same athlete, same long ride: 183W normalised power the first time, 184W the second, intensity factor 0.69 both times. Average heart rate dropped from 123 to 113 bpm.
Look at the shape too. The first ride sagged after about an hour and a half.
The second held level for its last hour. That’s the engine getting cheaper to run, and it’s what decoupling and durability measure.
Run: fewer heartbeats per km
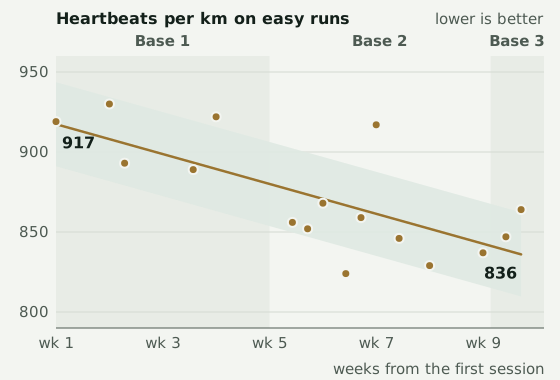
16 easy runs, with heart rate around 139 to 141 bpm the whole time. In the first block each km cost about 911 heartbeats. In the second it cost about 854.
So at the same heart rate, the hill-adjusted pace went from around 6:35 per km to around 6:05. Same effort, 30 seconds a km quicker, and all of it on easy runs.
Swim: pace and stroke count
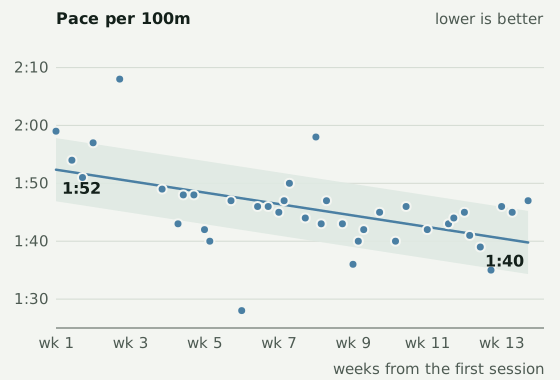
39 pool swims over 13 weeks. On the steady freestyle laps, pace came down from about 1:52 per 100m to 1:40 on the trend line, and strokes per 25m dropped from about 14 to just under 13. Faster with fewer strokes means each stroke is moving more water.
I don’t build a swim number on heart rate. A wrist watch in the pool is too unreliable for that.
How I decide it’s real
Every trend gets one of 3 labels: improving, worsening or no clear change. It only counts as improving when the change is bigger than half your normal session-to-session noise, and the maths is 90% sure it’s a real change. A single great session never moves the label.
What I do with it
- Improving: the block is working. Keep going.
- Levelling off: all 3 athletes above went flat in their latest few weeks. After a big climb that’s normal, and it’s also when I ask whether the block is still doing its job.
- Worsening: before I call it fitness, I check sleep, heat, illness, fuelling and how your week has gone. Efficiency moves with all of them.
Decoupling and durability in real files
These are the sessions I build to find out whether your engine holds up late in a long day, and what I read off them afterwards. Same rule as above: real athletes, no names.
Decoupling: same watts, longer ride
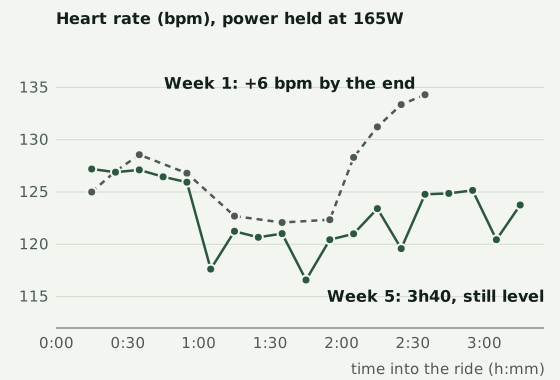
Week 1 was a 2h49 long ride. Through the steady parts at 165W, heart rate sat around 127 early and climbed to 133 in the last half hour. That’s decoupling: the same watts costing more beats as the ride goes on.
So the long ride grew in 15-minute steps. 4 weeks later it was 3h40, nearly an hour longer, at the same 165W. Heart rate started at 127 and finished at 123.
It’s not a perfect lab match. Week 1 was rolling, with some big-gear work in the middle hour, and week 5 was flat. But the steady watts were the same, and the drift had gone.
Durability: hour 4 against hour 1
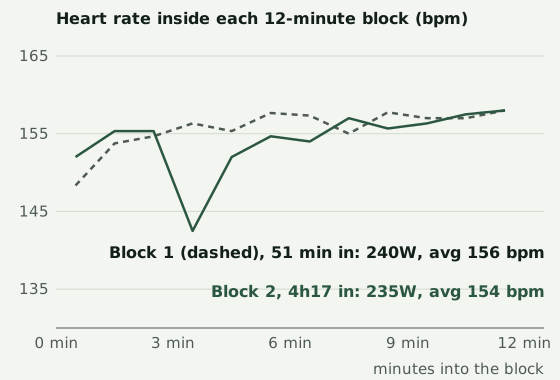
This is my Ironman durability test. Inside one long ride you do 2 matched 12-minute blocks at Ironman power, one about 50 minutes in and one after 4 hours.
Same watts, same position, same cadence. Then I compare what each one cost you.
Here block 1 was 240W at 156 bpm. Block 2, 4h17 into a 5h18 ride, was 235W at 154 bpm. Apart from one dip in minute 3, the 2 heart-rate lines sit on top of each other.
Hour 4 cost about what hour 1 did. For an Ironman athlete that’s the result that matters, and it’s the number I set race power from, ahead of a fresh FTP.
Intervals: where the drift starts
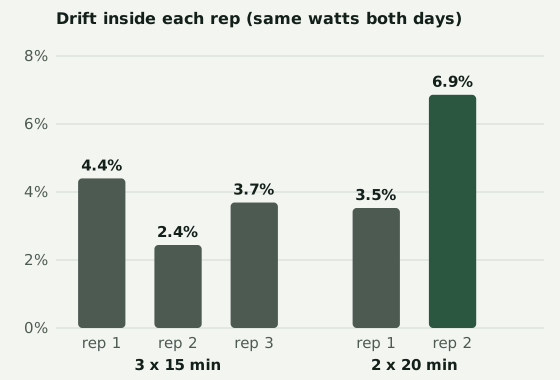
The 5% rule was written for long steady rides, so on intervals I compare you with yourself.
One week this athlete did 3 x 15 minutes at sweet spot. The next week, 2 x 20 at the same watts: less total work, longer reps.
The 15-minute reps drifted 2.4 to 4.4%. The second 20-minute rep jumped to 6.9%.
His limit at that power sits somewhere between 15 and 20 minutes. So he gets more 20-minute reps, and I watch for the drift to come down. If it doesn’t, I change the sessions.
HRV and resting heart rate: is the work landing?
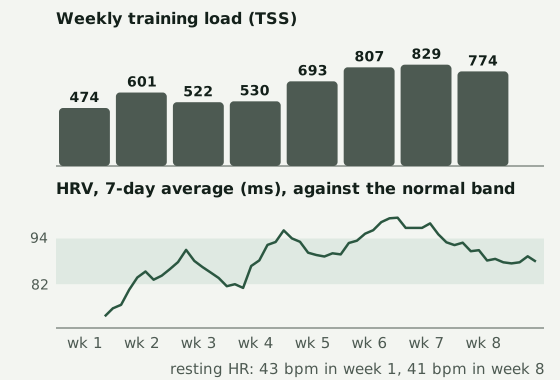
Most of you wear a watch to bed, so I use it. Every night I pull your HRV, resting heart rate and sleep, and compare your 7-day HRV with your own normal band from the last 60 days.
This athlete’s weekly load climbed from 474 to 829 TSS over 8 weeks. HRV started below the band, rose into it by week 2 and peaked above it in week 7. Resting heart rate eased from 43 to 41 bpm.
More work, and the body coping better with it: that’s an athlete absorbing the load. When it goes the other way, with HRV sliding under the band for days while the load climbs, I check in on sleep and how you’re feeling before the next hard session.
Work with me
I coach from Auckland, 1-on-1 through TrainingPeaks. If you want these numbers read for you every week, get in touch. Or start with a training plan.
Mark Bowstead raced as a professional triathlete from 2012 to 2020 and has coached endurance athletes since 2017 through Bowstead Performance Coaching.